Wing-clipped Port of Los Angeles TEUs Plummeted 17% in August
Posted on 10/18/22 9:41 AM
East and Gulf Coast Ports Overtake West Coast in Imports
The backlash at America’s largest seaport seemed inevitable. Not that many months ago, upwards of 120 ghost ships languished well off L.A.’s coastline waiting to berth and offload cargo.
Recent History
In late November of 2021, California air regulators “agreed” that the ships waiting in San Pedro Bay were not good for the environment. Those ships were moved an astonishing 300 miles out to sea, well beyond the 25-mile demarcation for “official” waiting-to-berth status with Christmas season in full tilt. Those “removed” ships were no longer counted—in port parlance, they didn’t exist.
In December of 2021, the official word from D.C., i.e., the Whitehouse, was that the “shipping crisis” was over, an illusion that would make even David Copperfield proud: in January of 2022, over 150 ships still waited off coastlines in North America to offload cargo.
Yet it wasn’t just the anchored ships waiting to berth that bogged down the supply chain. Skyscrapers of crayonesque shipping containers waited for ground transport. To compound the logistics logjam, reports of infighting between unions at the Port of Los Angeles continue; there has yet to be a breakthrough in labor negotiations, and the latest rail labor contract has yet to be approved as one of the unions promptly rejected the proposal.
Winds of Change
Behold August of 2022, when Port of Los Angeles throughput declined 17%. Throughput for September is trending about the same as August as September reports are soon to be released. In September only six ships waited off the L.A./Long Beach ports, the lowest number since October of 2020.
Los Angeles’ performance stands in stark contrast to the August numbers announced by the Port of Savannah in Georgia. Savannah handled 290,915 twenty-foot equivalent units (TEUs) of loaded imports in August, by far the highest tally in the port’s history. Savannah’s August imports were up 15.6% from July; it was also 14.7% higher than its previous record month (May).
One coast’s spoiled limes is another’s key lime pie.
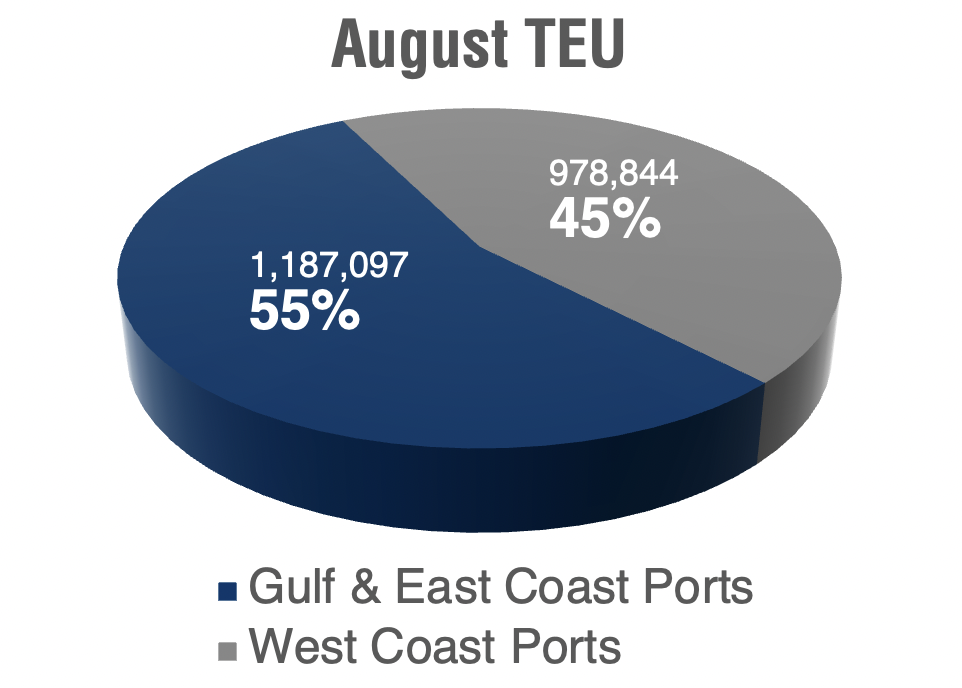
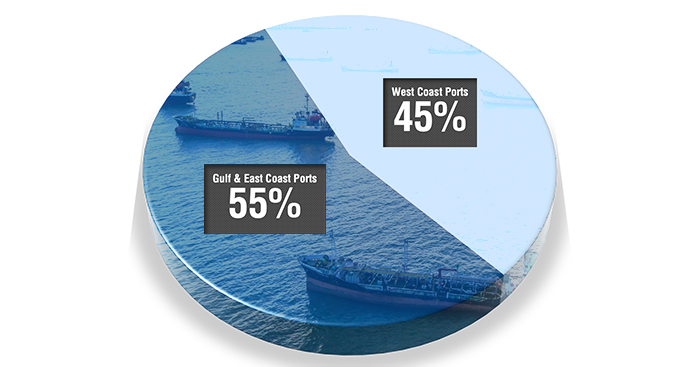
True to the American entrepreneurial spirit, U.S. Gulf and East Coast ports picked up the slack. The Port of Los Angeles, year-on-year, was down 15.5% from August of 2021. Gulf and East Coast ports roared to the fore to outpace West Coast in TEU throughput. August’s final score: Gulf and East Coast ports 1,187,095, West Coast ports 978,844.

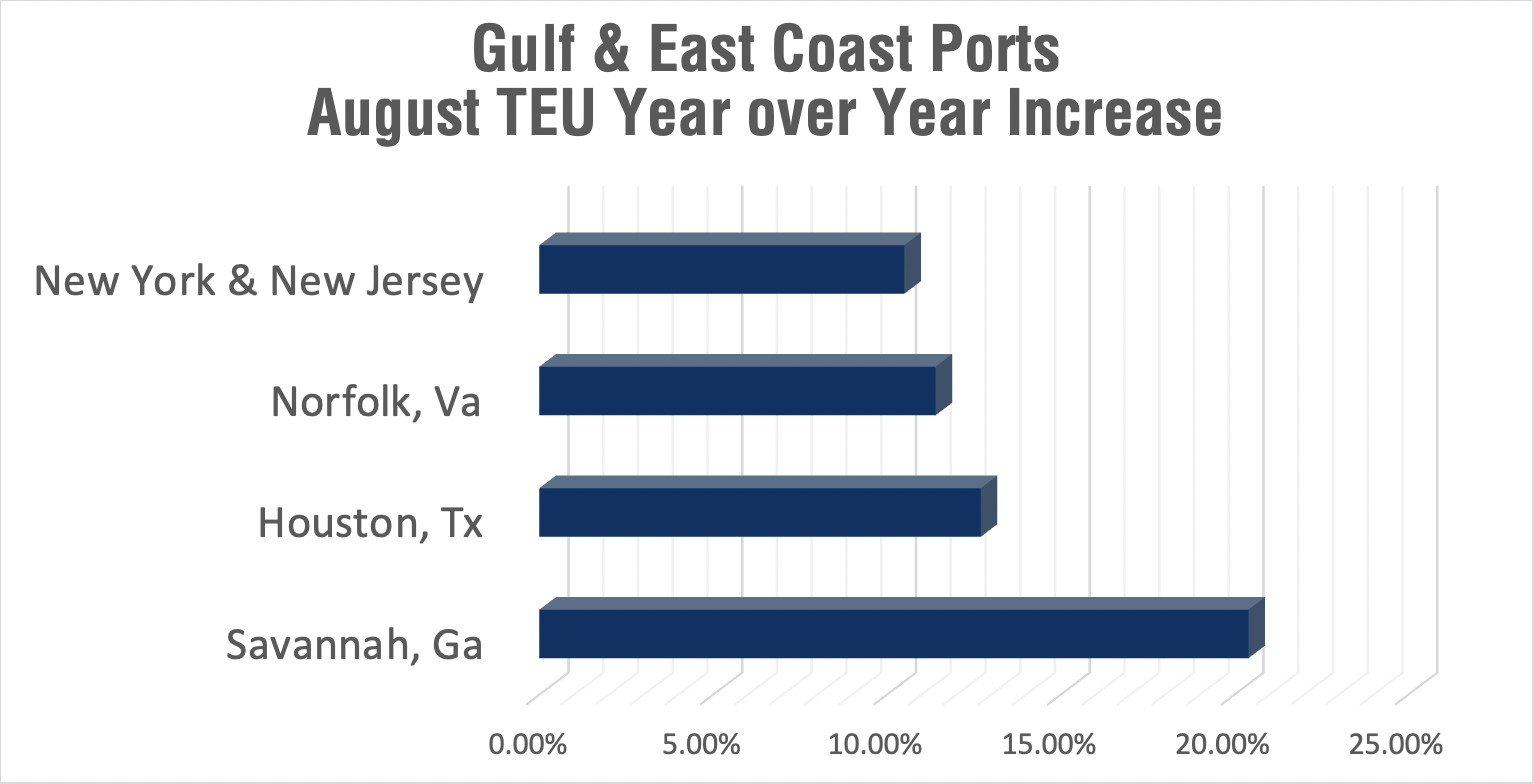
That’s a monthly cargo throughput difference that makes a difference; it’s more shipping TEUs (208,251) than either Samsung America or Family Dollar Stores/Dollar Trees stock in an entire year. Savannah, Georgia, led Gulf & East Coast ports with a 20.4% increase, followed by Houston (12.7%), Norfolk (11.4%), New York and New Jersey (10.5%).

Keep in mind these were individual port gains year on year. It should also be noted that in July, TEU volume at Port Houston was up 21% while the nationwide average was 4%. In June, Port Houston implemented Saturday gate hours from 8 a.m. to 5 p.m. at two terminals to help reduce dwell time. Savannah’s huge 20.4% increase as well as besieged Florida ports will likely drop percentage points in future reports due to Hurricane Ian.
While one could cherry-pick data to portray the seismic shift or sea change in East versus West Coast imports as temporary, the current trend is likely more Occam’s Razor than not—union hurdles at West Coast ports plus less transportation restrictions at Gulf and East Coast ports equal more TEU throughput.
Topics: designing for export, USA Made Products, shipping, manufacturing


